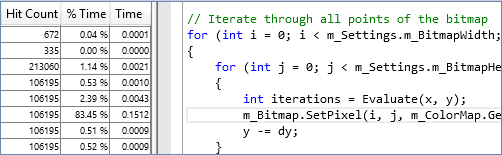
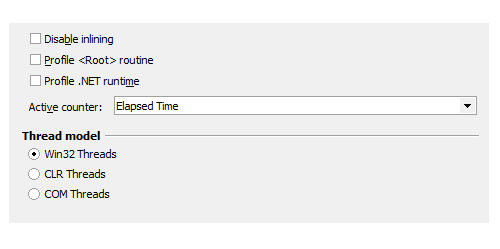
Performance Profiler
Bottlenecks hinder your application from functioning at peak performance and damages the user experience. AQTime Pro includes performance profiling reports that help you easily identify functions and call paths that are causing the greatest impact on your application performance.
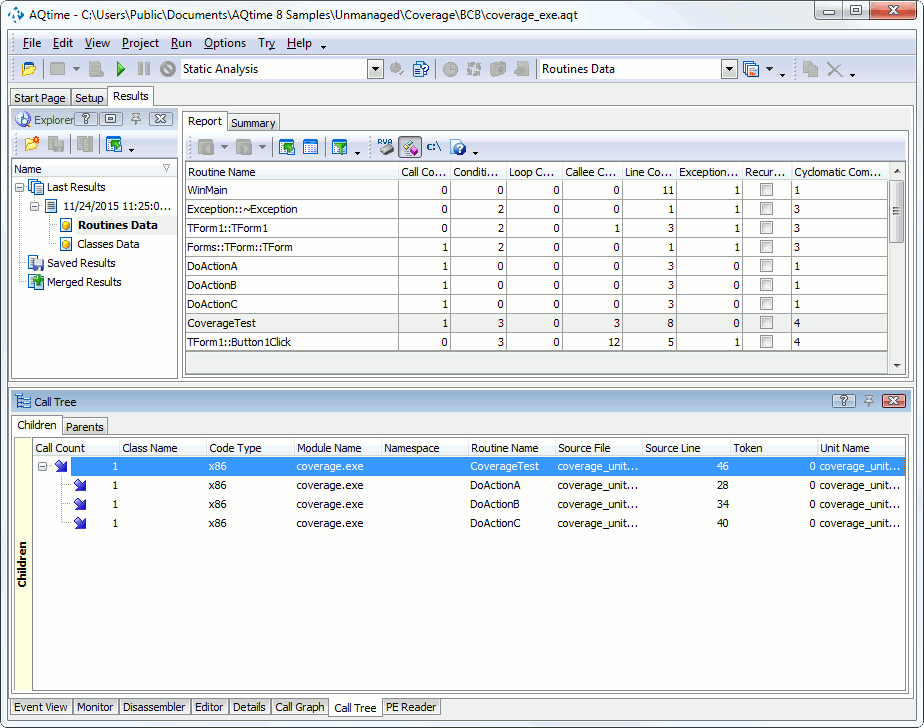
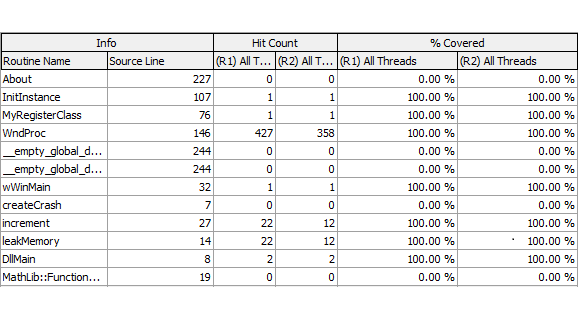
Code Coverage Profiler
Lower code coverage increases the likelihood of application performance degradation. In addition, code coverage gaps mean there may be hidden bugs lurking in your code that you need to test for. AQTime Pro includes Coverage and Light Coverage profilers to help you trace untested code or find unnecessary routines and code lines that are never called.
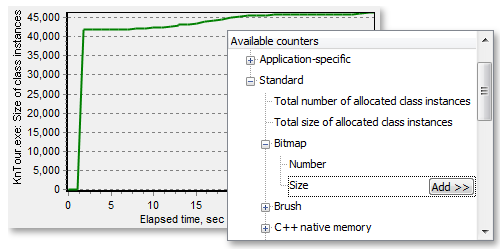
Memory Leaks
Memory Leaks are elusive, they gradually destroy performance runtime and ultimately cause applications to crash. AQTime Pro’s Allocation Profiler shows your application’s memory and resource allocations in real time to help you detect excessive memory and resource usage finds memory leaks so applications can run at peak performance.
C/C++ Code Profiling
AQTime Pro improves quality of your C and C++ applications by finding performance bottlenecks, memory/resource leaks, and more.
.NET Profiling
AQTime Pro is also able to profile across managed code and frameworks such as .NET. AQtime Pro optimizes .NET application performance and memory usage, measure code coverage and trace exceptions.
Delphi Profiling
AQTime Pro provides top-to-bottom Delphi application analysis, including performance profiling, memory and resource profiling, code coverage, unused unit detection, code metrics, exception tracing and integration with RAD Studio.
Visual Studio & RAD Studio Integration
AQTime Pro can be used as a standalone profiler, as well as integrated into Microsoft Visual Studio and Embarcadero RAD Studio for improved developer productivity.
Intuitive Reporting
AQTime Pro’s intuitive reporting helps developers drill down deep and find the root cause of their code bugs fast. It gathers information for each line of the source code within routines that were added to the area.