Digital Experience Monitoring for SaaS and Web Applications
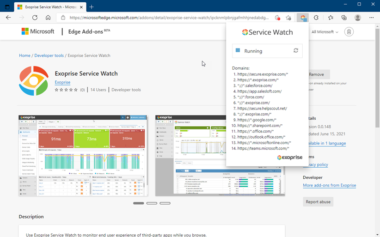
- Service Watch Browser is a browser add-on for monitoring the real user experience of specific domains, web, and SaaS applications to proactively detect website performance problems.
- Information Technology leaders must ensure end-user satisfaction with application delivery, network connectivity, and services for the Work From Anywhere digital employee.
- Diagnose slow SaaS providers, ISPs, Wi-Fi, and proxies no matter where the user works from; home office, branch office, headquarters, or on the road.
Capture SaaS Visibility from the Users Perspective
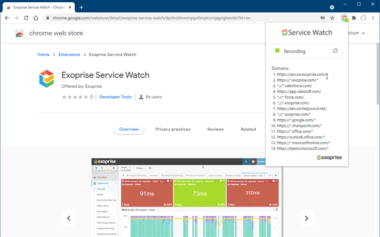
Secure extension with filtered domains for your SaaS web browser app.
Network Diagnosis From #WorkAnywhere
Capture and troubleshoot employee experience everywhere
Combine with Service Watch Desktop for Complete Visibility
Service Watch Desktop includes Service Watch Browser. Read more about it.
Securely Collect End-User Experience for Any App
Limit user data to just the apps, URLs, and Domains that need diagnosing. Capture session metrics across servers, SSO, Proxies, LAN/WAN, Wi-Fi, and VPNs.
Real-Time Dashboards for Every User, App, and Domain
- Scorecards highlight network, server, or client issues, trending and more
- Filter by User, Group, URL, Domain to highlight issues
- Pinpoint slow website response time, latency, and poor networks
- Custom dashboards for the help desk, application owners, network admins and upper management
- Real user monitoring for SaaS browser app
Service Watch Browser Deploys In Minutes for Real User Monitoring
Diagnose end-user, application, and network issues without complicated deployments
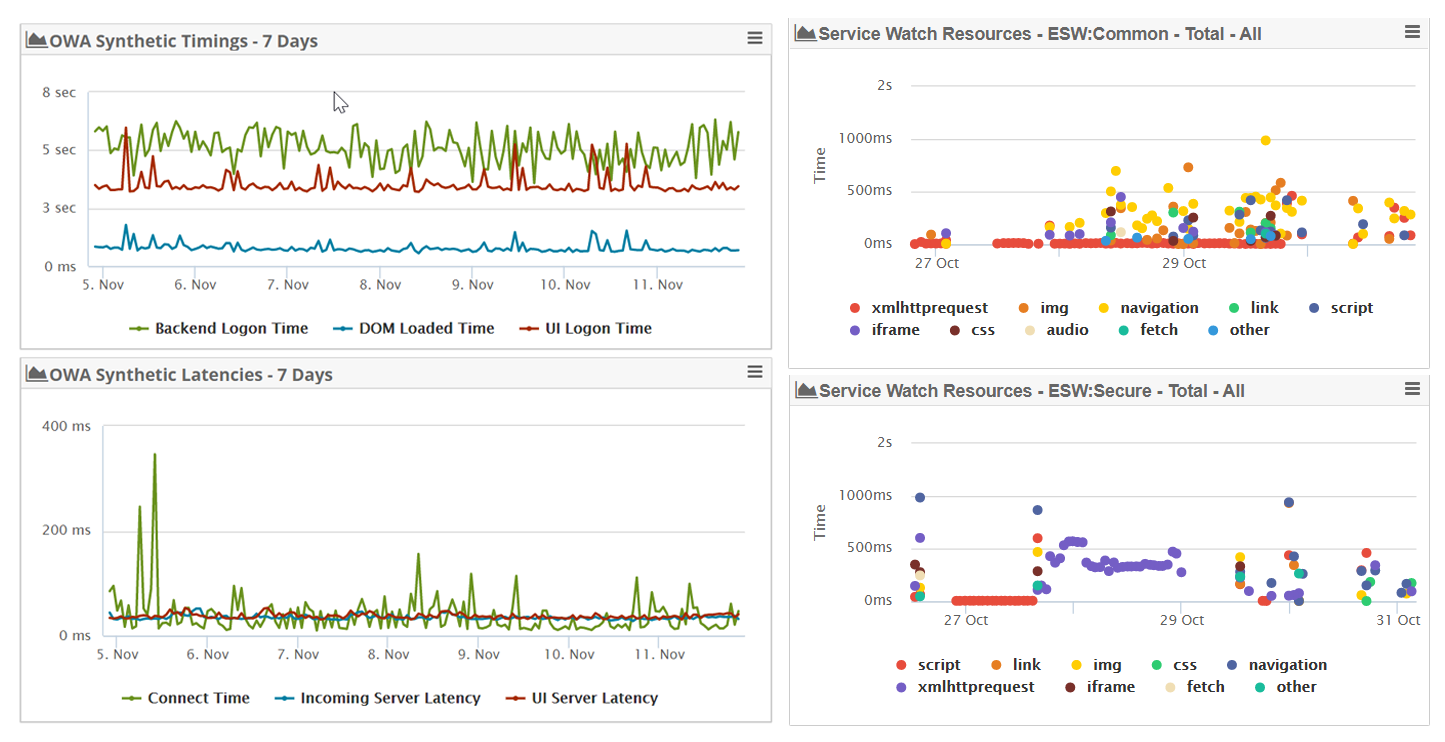
Correlate Real-User Monitoring With Synthetic Transaction Monitoring
Real User Monitoring is great for diagnosing specific user, browser, web-based application, or network issues but doesn’t notify you before a user is affected. RUM doesn’t help with outage prediction or help you in advance.
Deploy CloudReady synthetics along with Service Watch to capture the complete Digital Experience Monitoring (DEM) picture. Know in advance of a problem — know before a business unit is impacted.
Real User Monitoring Plus Synthetics In One Platform
Monitor proactively to know in advance, get complete coverage for every user, every network, every app in addition to passive monitoring of web applications.
Pinpoint The Issue
Service Watch for chrome browser app pinpoints the issue — down to the server, resource, CDN, ISP, and network hop for every user no matter where they roam. Real-time browser application monitoring for the real end-user.
Service Watch Browser Real User Monitoring For SaaS & Single-Page Apps
- Many Software-as-a-Service applications like the new Microsoft’s Outlook Web Access, Google Gmail, and Salesforce Lightning have unique requirements when it comes analyzing performance and the digital experience. These applications are what’s called Single-Page Apps (SPAs) and operate differently than traditional web pages that cause a complete refresh of the page.
- SPAs use JavaScript and background requests to fetch resources and build pages. This should create a faster user experience similar to desktop or mobile applications. React and Angular are two popular JavaScript frameworks used to create SPAs. Many parts of CloudReady, itself, are SPAs utilizing Angular and other frameworks.
No RUM Script Injection
SaaS SPAs can’t be instrumented using legacy RUM — you don’t have access to the servers
More Client-Side Demands
Single-Page Apps have higher browser, client-side, and long-running memory demands
See Beyond the Browser
SPAs are XHR/long-running and behave differently through proxies, firewalls and branch offices
Analyzing SaaS and Browser Based Applications for Slowdowns and Poor Performance with Real User Monitoring
Software-as-a-Service applications like Salesforce Lightning, Gmail, and OWA are often long running applications that download and update resources in the background. These apps leverage functions within a browser such as service workers or a key function called XmlHTTPRequest (often abbreviated as XHR).
These features, common to modern browsers, enable an application to be more responsive and dynamic and to act more like a desktop or mobile application. But they also make finding performance problems or debugging issues more challenging.
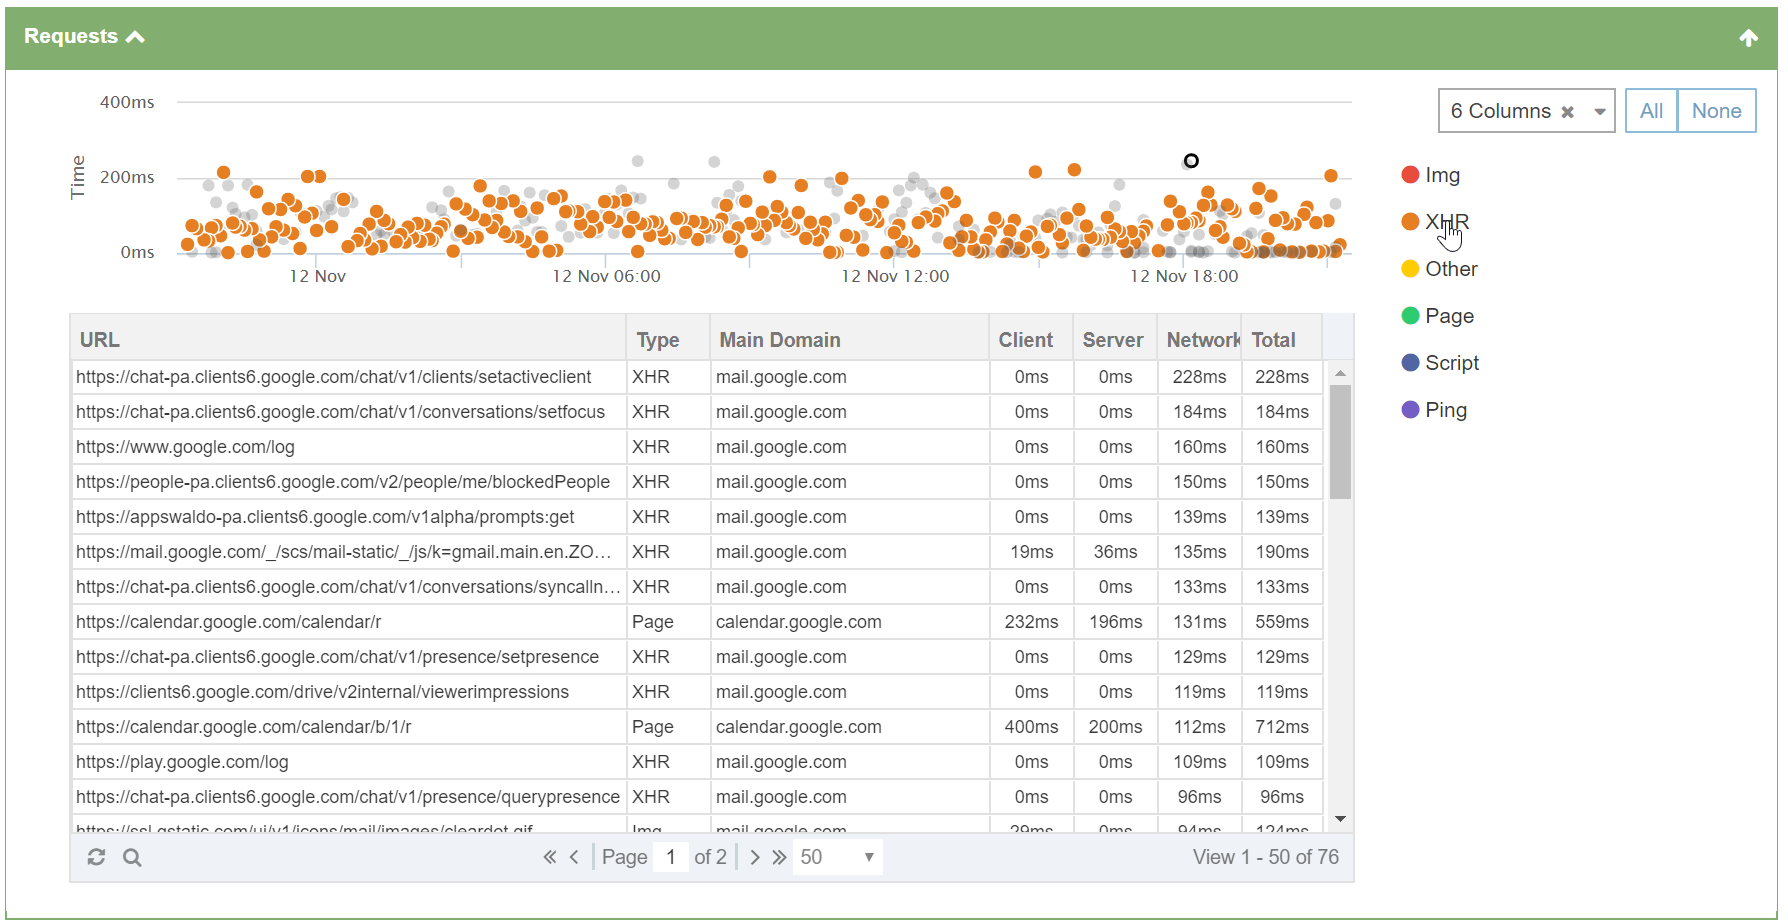
All Application Requests
Service Watch frontend monitoring captures all of the web traffic requests that a Single-Page App like Gmail makes and aggregates for performance analysis and user behavior.
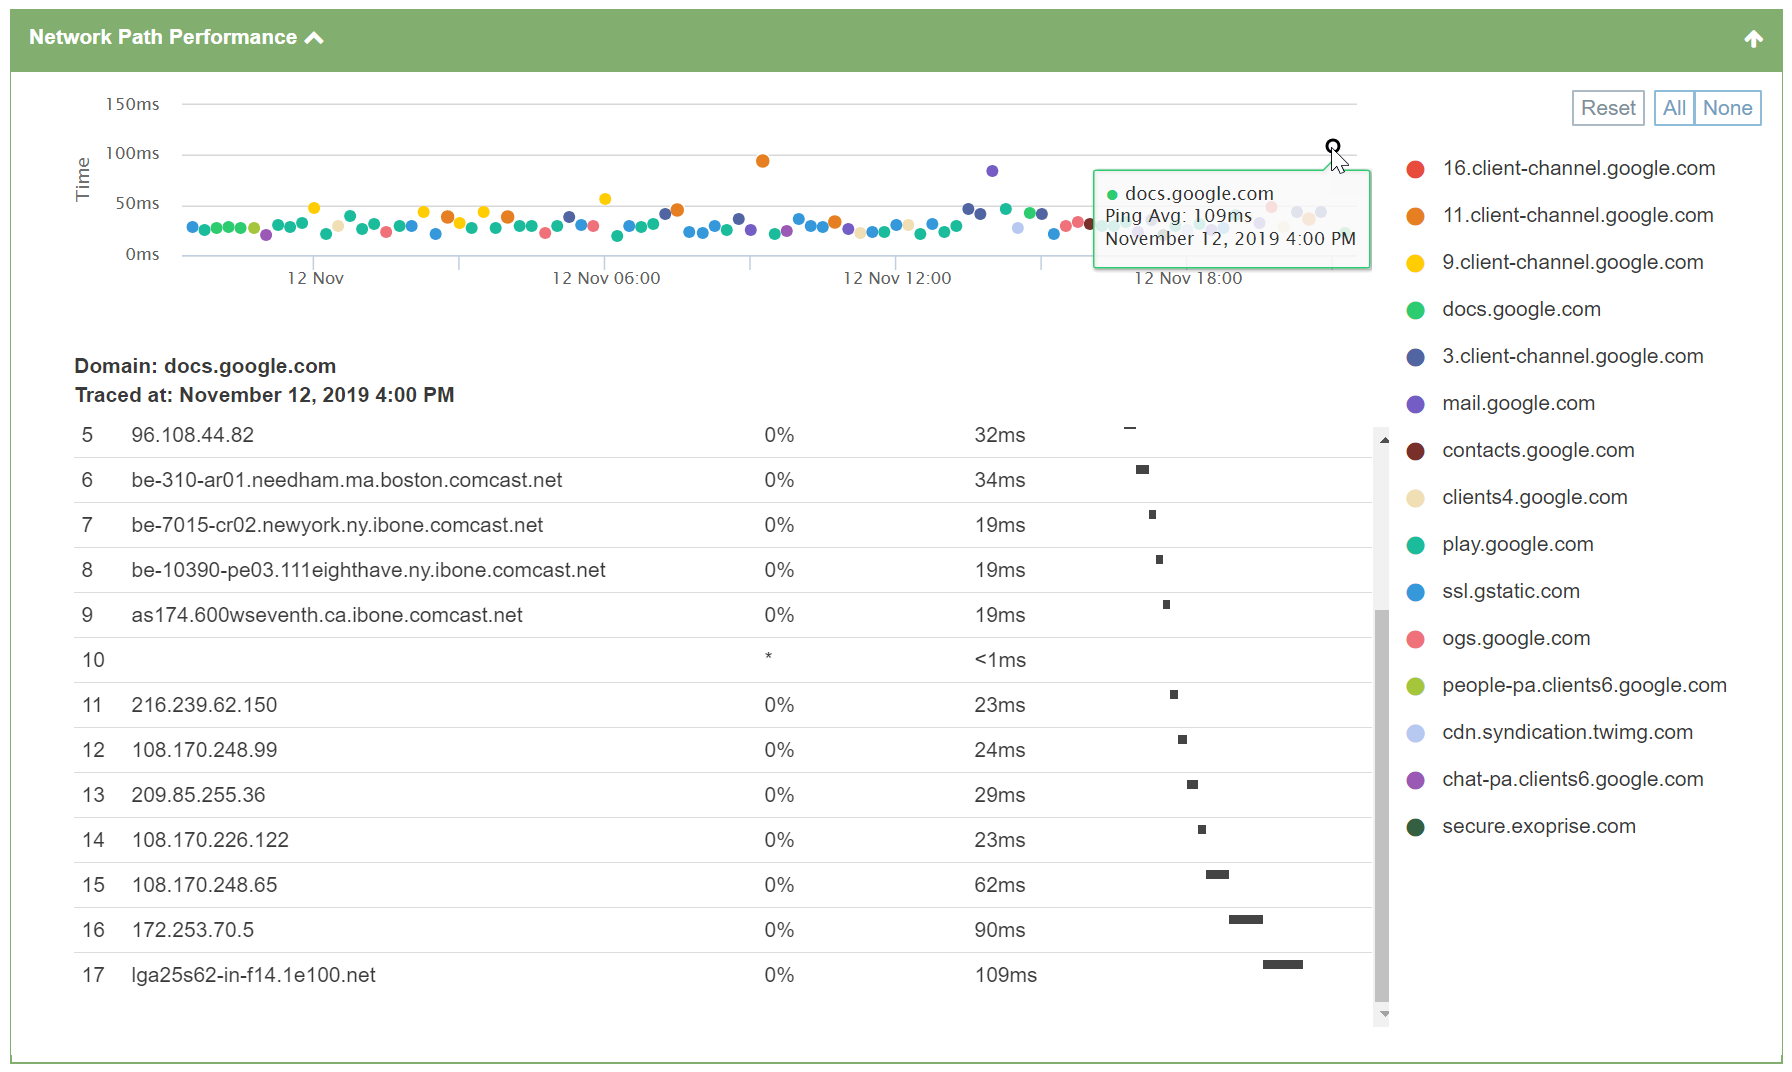
Hop-by-Hop Network Traces
Combined with Private Site installations, capture low-level network path performance information for network administrators to identify the slowest requests and map it for user journey and location.











 WhatsApp
 LinkedIn
 Facebook
 X
X
 Email
Email