From big picture story to the most impactful details
Display
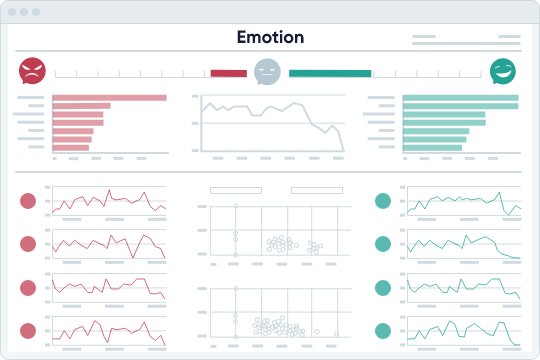
Enhance audio evidence with graphical presentation that is easy to customize and annotate based on key points of interest.
Examine
Drill-down details reveal insights based on customer behaviors, agent performance, process challenges and other root cause indicators.
Share
Create graphics that can be understood organization-wide, from contact center to C-Suite, to spread impact.
CallMiner insights displayed with the power of Tableau
CallMiner Visualize is powered by Tableau, the market-leading choice for modern business intelligence. Together, our technologies create the most powerful tool for visual storytelling with conversation analytics.
Clearly see how data impacts productivity
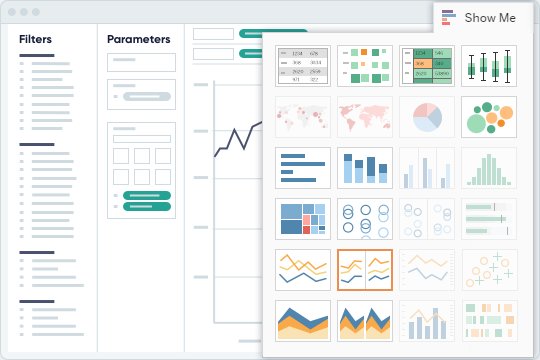
Powerful Editing
Easy drag-and-drop features for charts, graphs, and tailored dashboards
Simple interface helps manage, import, and present data at scale
Pre-built reports deliver insight as quickly as possible.
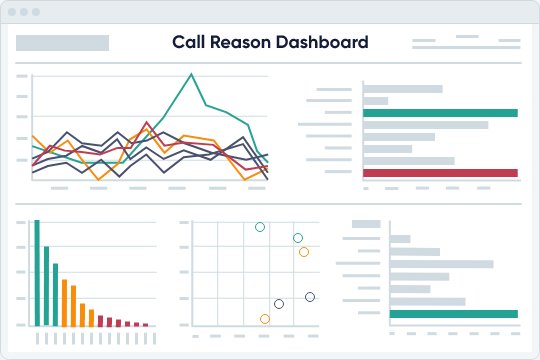
Interactive Agility
Easily identify patterns across customer interactions to inform key business decisions
Use before-and-after assessments to measure the impact of agent coaching, as well as ROI assessments of bottom-line benefits
Connect different data points and compare results to support root cause hypothesis with data-supported evidence.
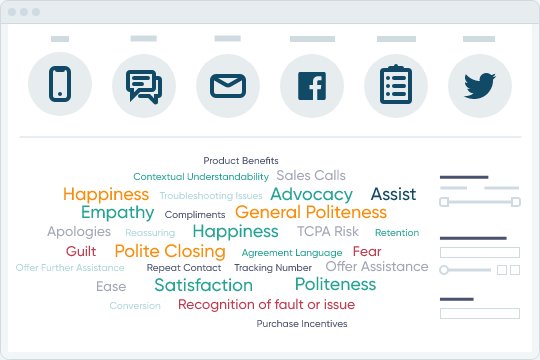
Impactful Awareness
Uncover and spotlight key opportunities using identifying titles and tags
Fortify audio evidence with graphics that pinpoint the scope of an issue and attention required to solve it
Visual data encourages enthusiastic attention and action within and beyond the contact center.
Key Features
Configurable Storytelling
Customize how data displays, telling the story from various angles for insight into any business scenario.
Simple Comparisons
See how peformances rank across the team or between individual agents to find out what drives success.
Scales with Your Growth
Understand the big picture even as that picture grows, modeling your success in simple infographics no matter how large your organization gets.